Metrics
As you know, once you have activated the metrics feature you will be able to see the following panels:
Developers
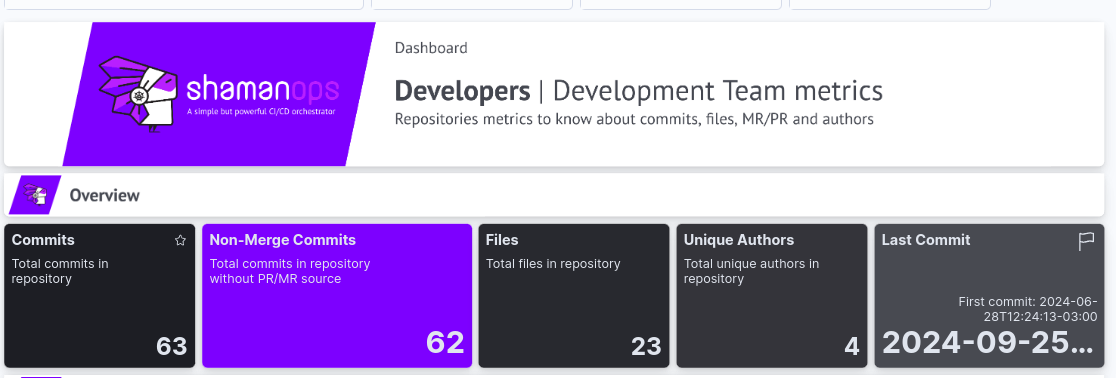
In this section you will be able to visualize the total count of commits,the total count of the commits that didn't end on a pull request, the total number of files, the count of the unique authors that have collaborated and when was the last commit made.
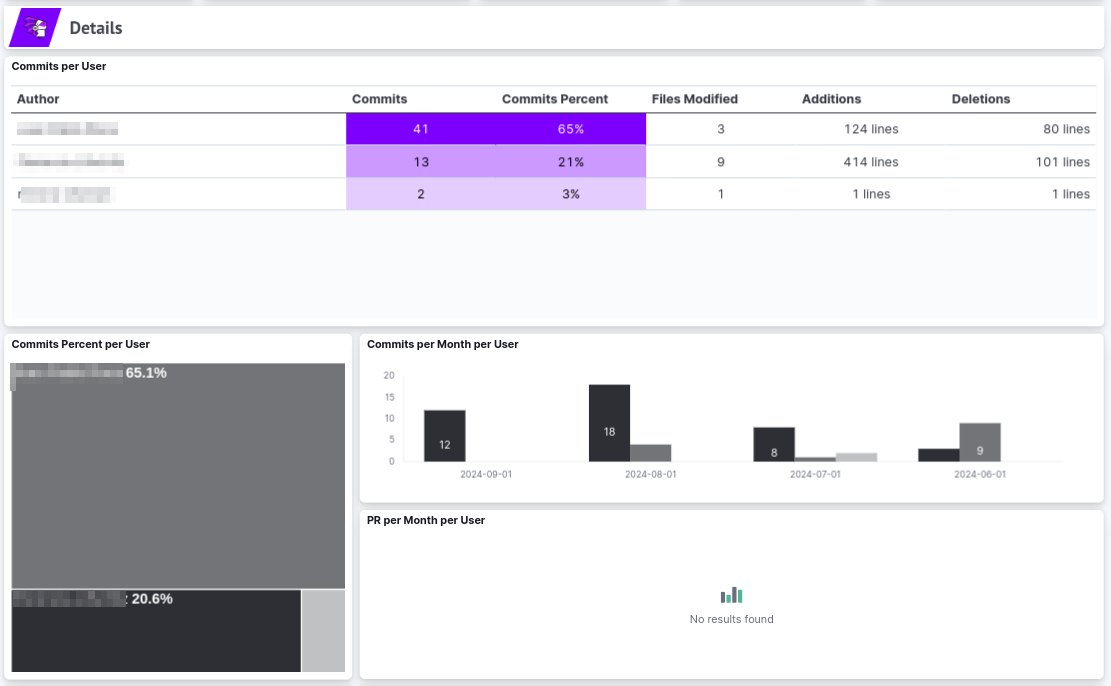
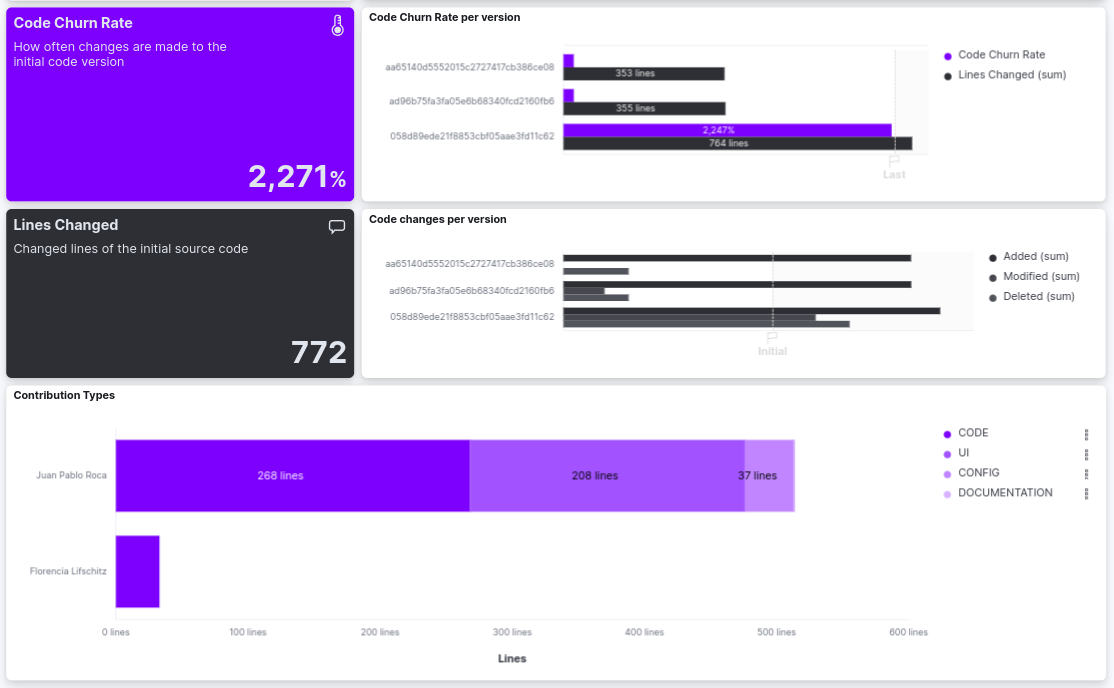
Iin this section you will be able to visualize the percentage of each single author's collaboration, the amount of commits per user and the action they took in the commit (Modified a file, added something or delete something), the amount of commits and pull request per user per month, the total code churn rate, the code churn rate per version, the amount of lines changed and the type of code changes per version.
You can also find here the type of contribution the user made based on the type of file that was modified (UI, configuration, code).
DevOps
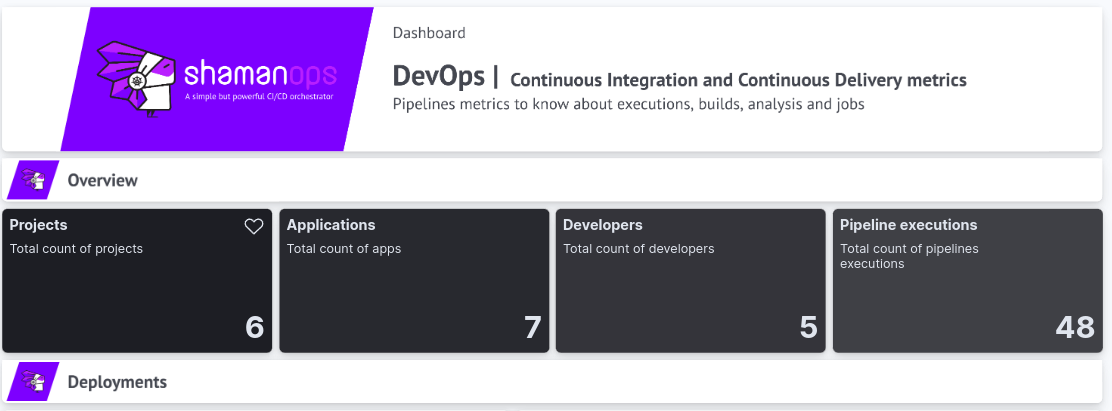
In this section you will be able to visualize the total count of projects, the total count of applications, the total count of developers that are working on your repositories, the total amount of pipeline executions and the total amount of builds that were made.
In this section you will be able to visualize the number of deployments that were successful per environment, the applications per project, the amount of active users per project, the amount of builds that were submitted, the amount of builds that were omitted to save time (because there was no need to re-build the image), the amount of builds that were effective, the building average time and the top of the programming languages that are used.

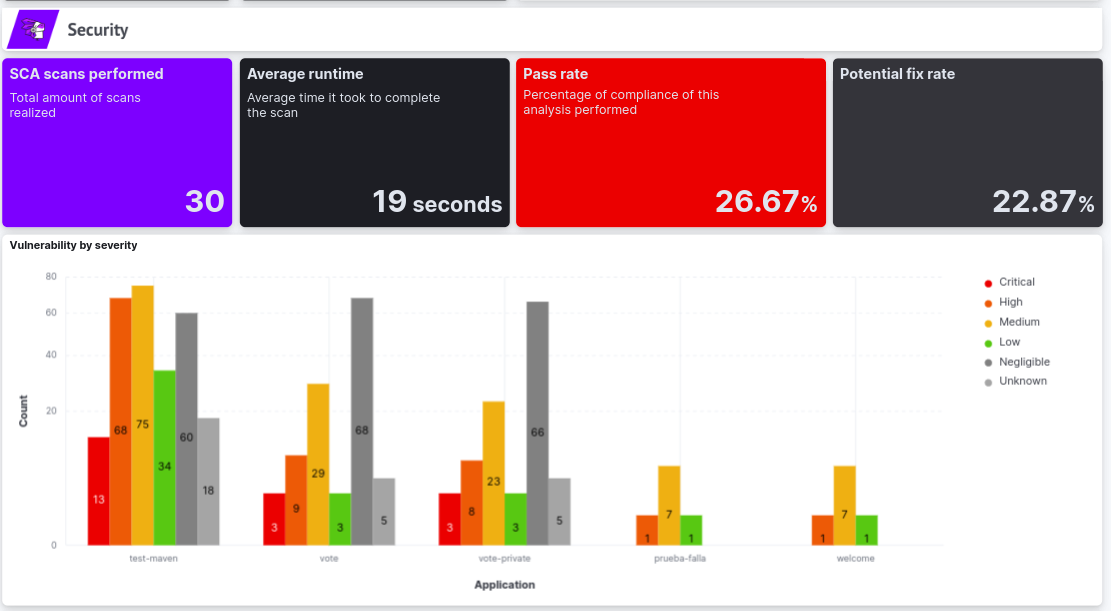
In this section you will be able to visualize the total number of SCA scans that were performed, the average runtime of those scans, the pass rate and the potential fix rate. You will also find here a count of the found vulnerabilities by severity
In this section you will be able to visualize the amount of code quality scans that were performed, the pass rate and the average runtime of those scans, and also the percentage of the time that the scan was blocking.

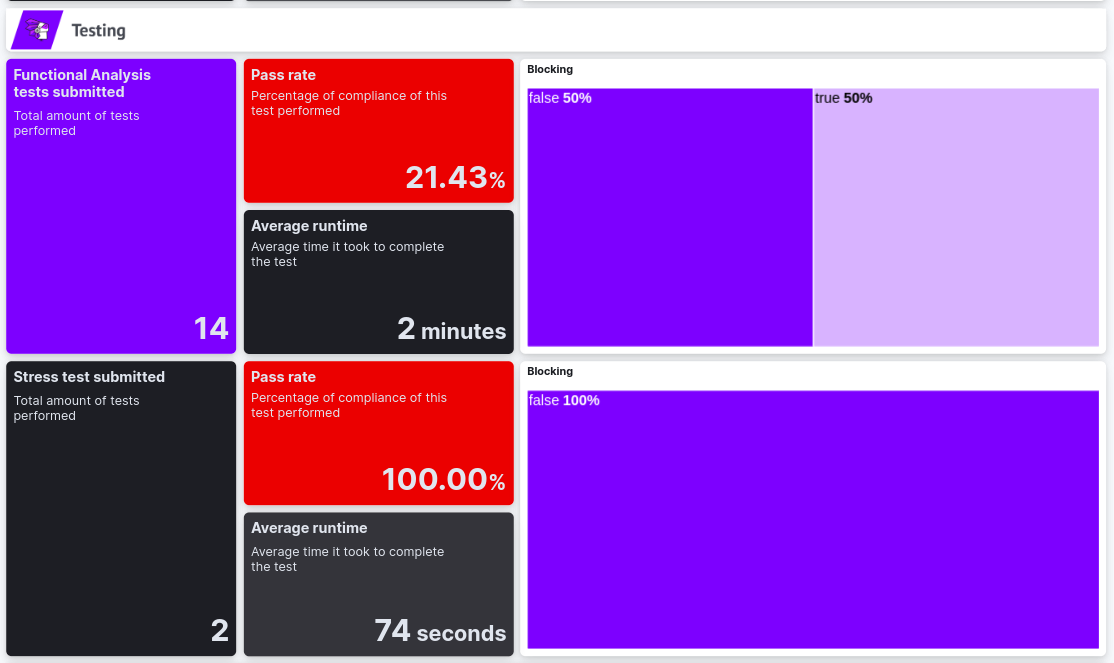
In this section you will be able to visualize the total amount of functional analysis tests and stress test that were submitted along with the pass rate and the average runtime of those jobs. You can also visualize the percentage of how many times the result of that analysis was blocking or not.
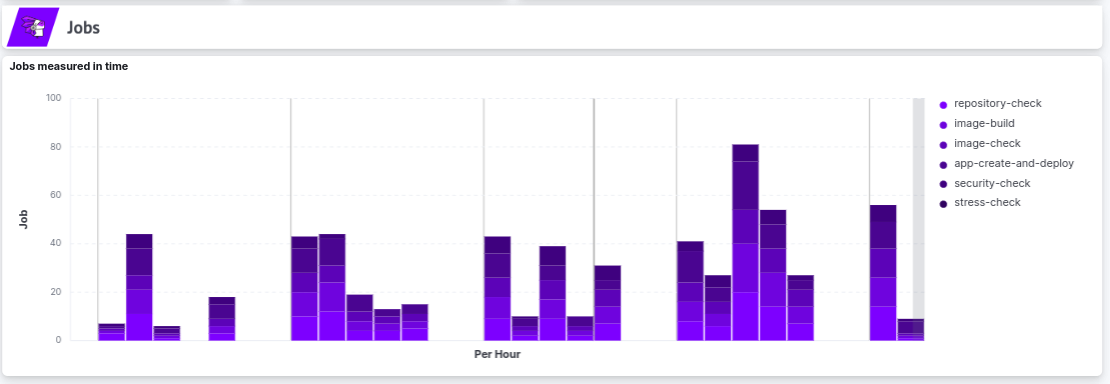
In the last section available you will find all the jobs that are executed by ShamanOps measured in time so you can know how long each one takes.
KPIs
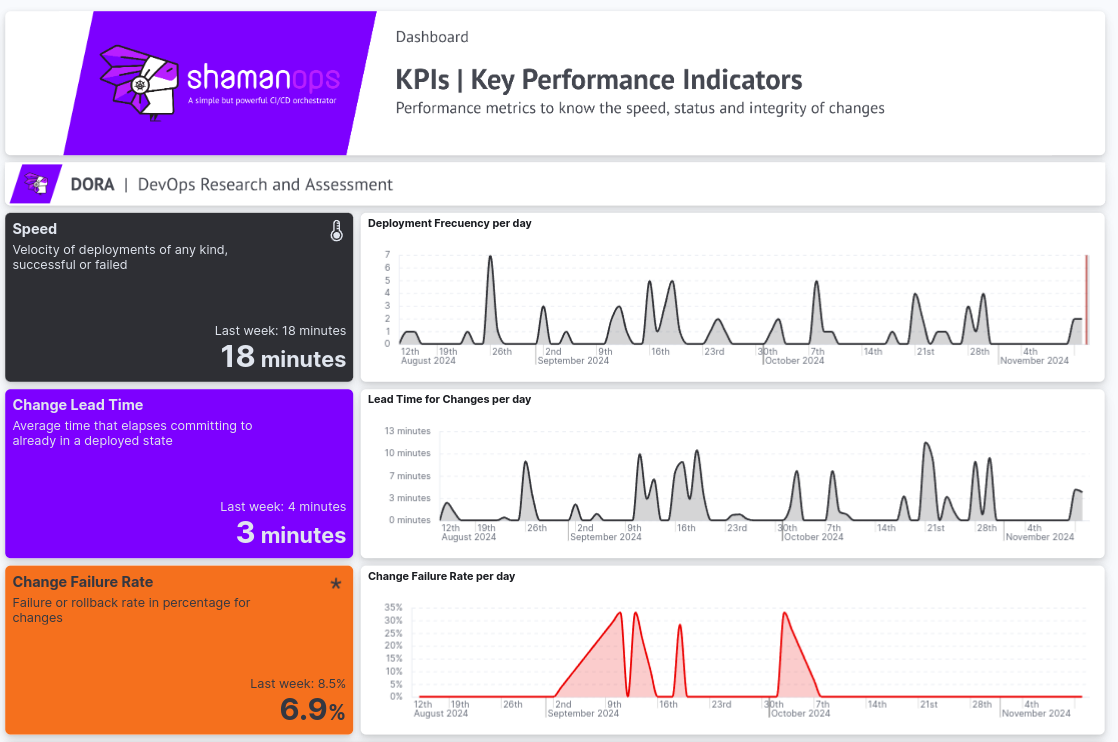
In this section you will be able to visualize some DORA metrics such as: speed of the deployments, the change lead time adn the change failure rate
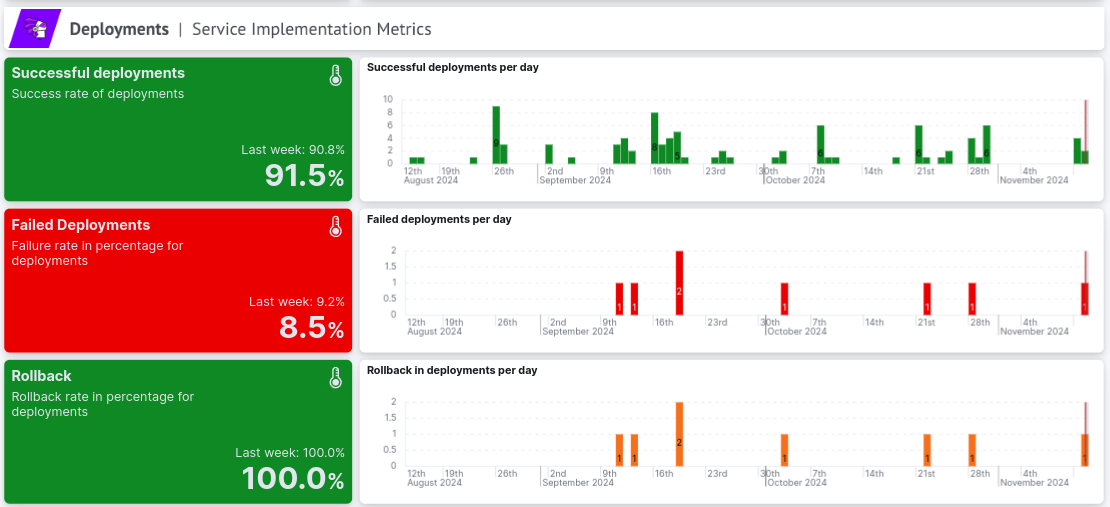
In this section you will find information about the deployments: how many were successful, how many failed, how many rollbacks there were
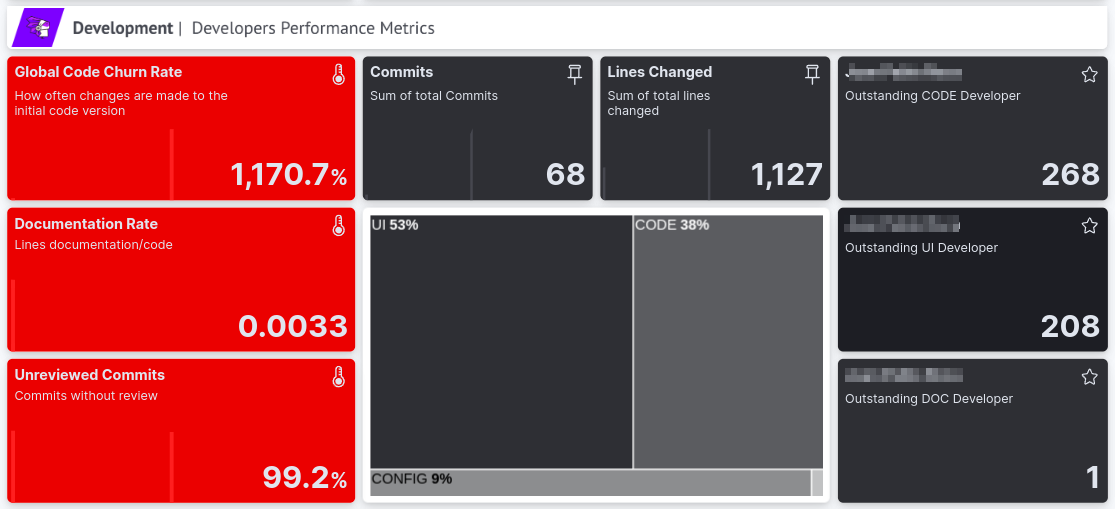
In this section you will find information about the developers performance while generating the deployments we've seen above
Costs
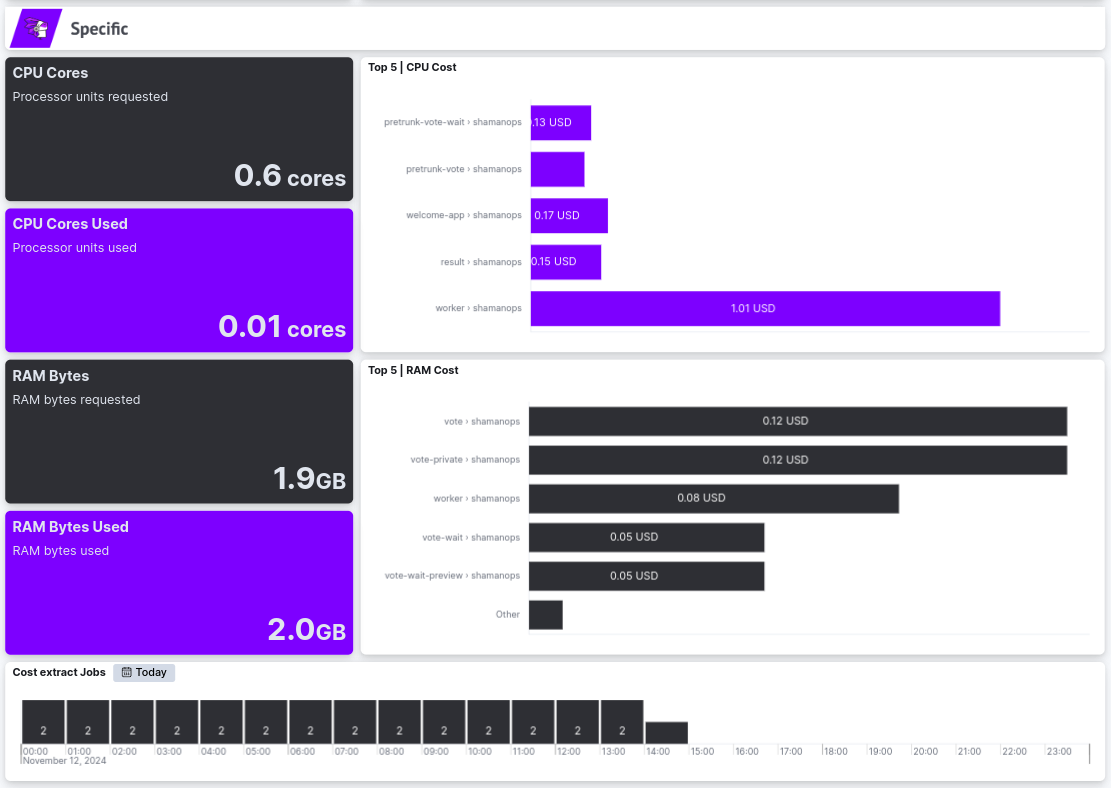
In this section you will find some metrics about the cost that is generating the CPU, RAM, Storage and GPU expressed in different ways: by application, by project, by environment, etc.
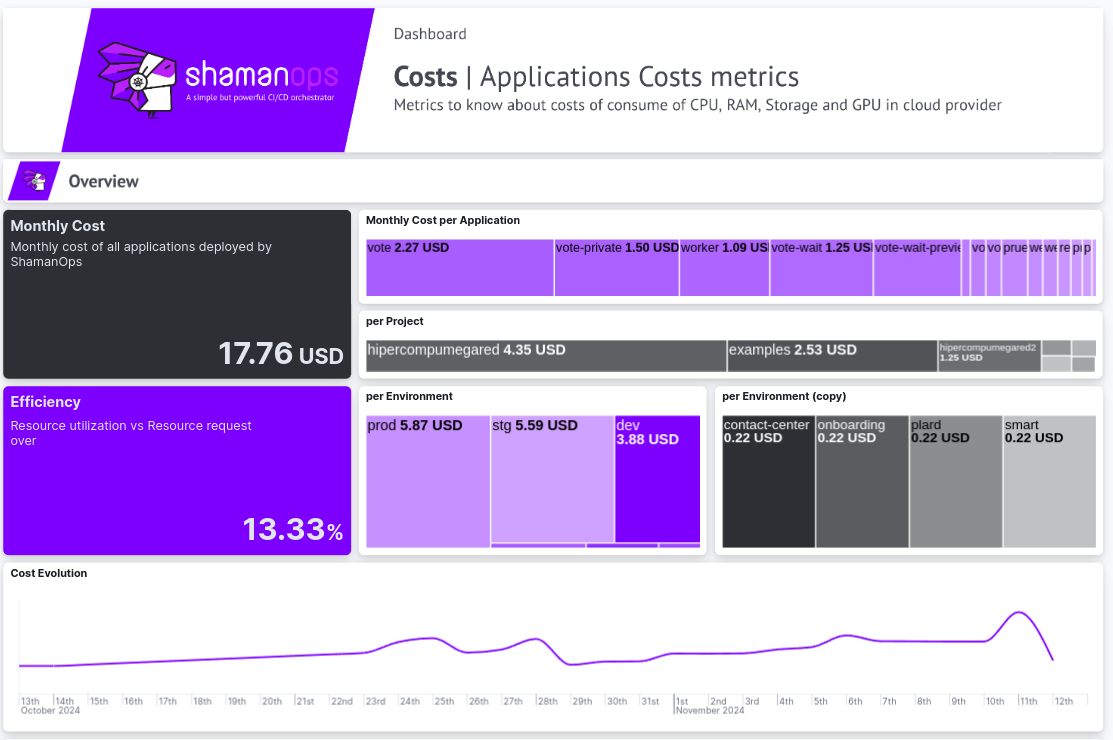
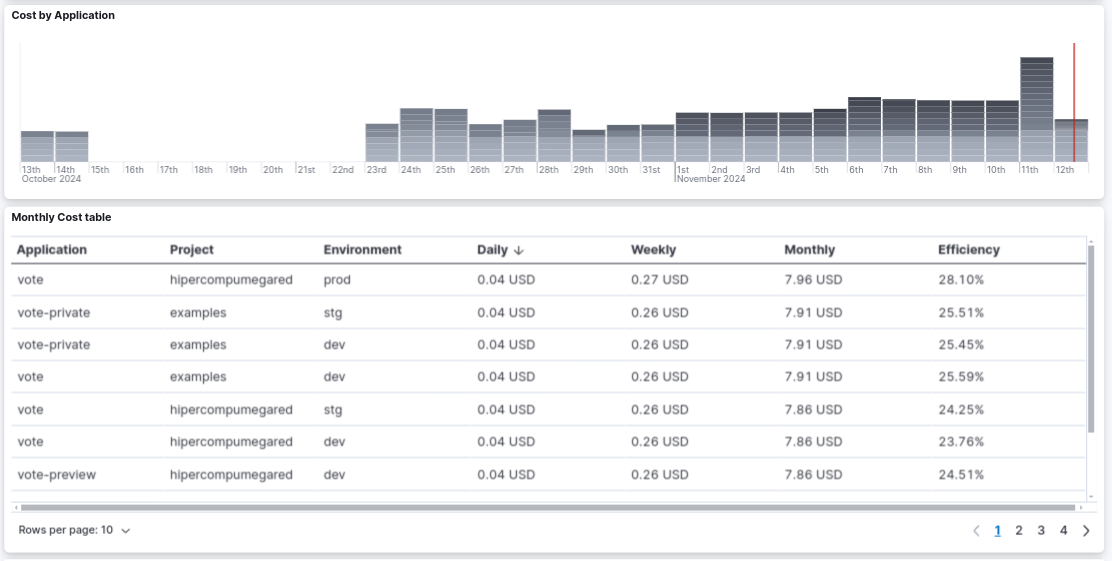
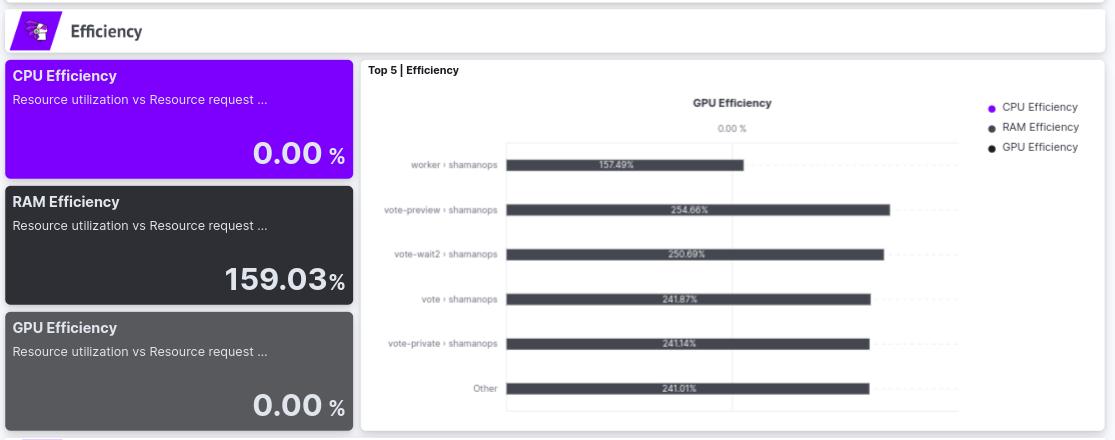
And also some metrics about efficiency and some specific values
And some more dashboards are comming to improve your ShamanOps adventure! ✨