Observability
As you know, once you have installed ShamanOps, you will automatically have available to view multiple dashboards with the following information:
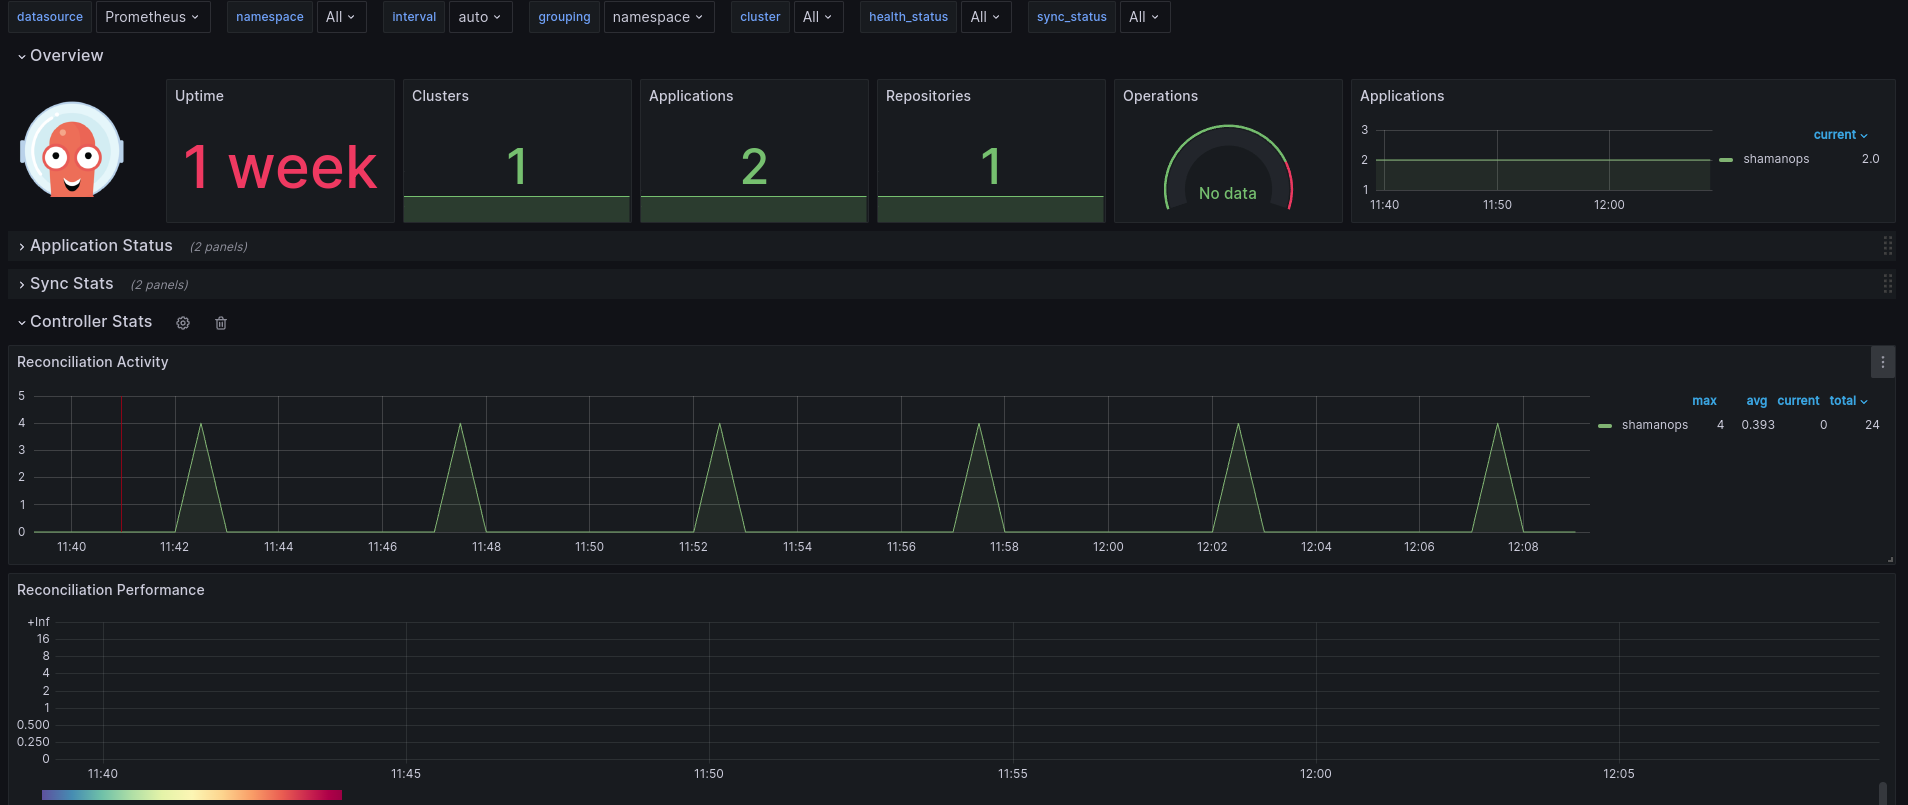
Continuous Deployment
In this dashboard you will be able to visualize the general status of the ArgoCD that was deployed by ShamanOps taking in consideration the status of the applications, the status of the syncs performed, the status of the controllers, etc.
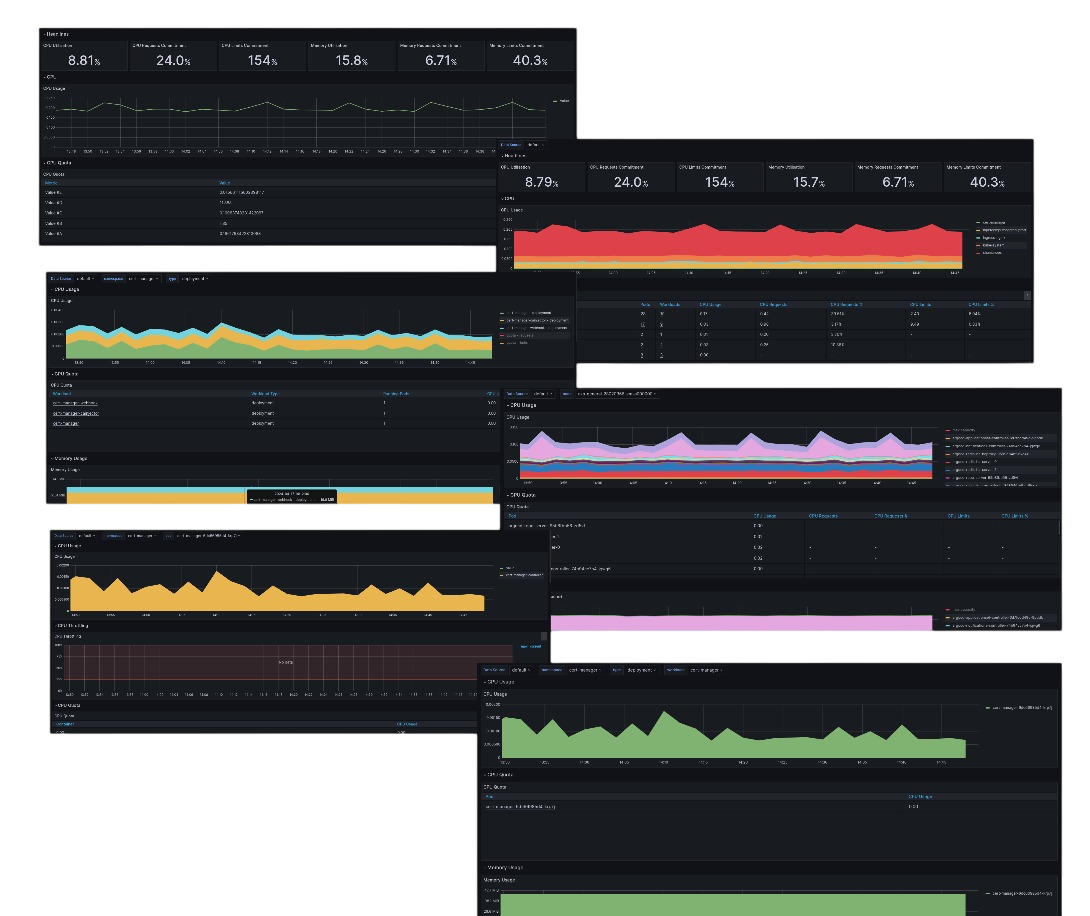
Compute resources
In this dashboard you will be able to visualize the status of the compute resources that are being used by the different components of the kubernetes-based platform such as: pods, nodes, namespaces, workloads.
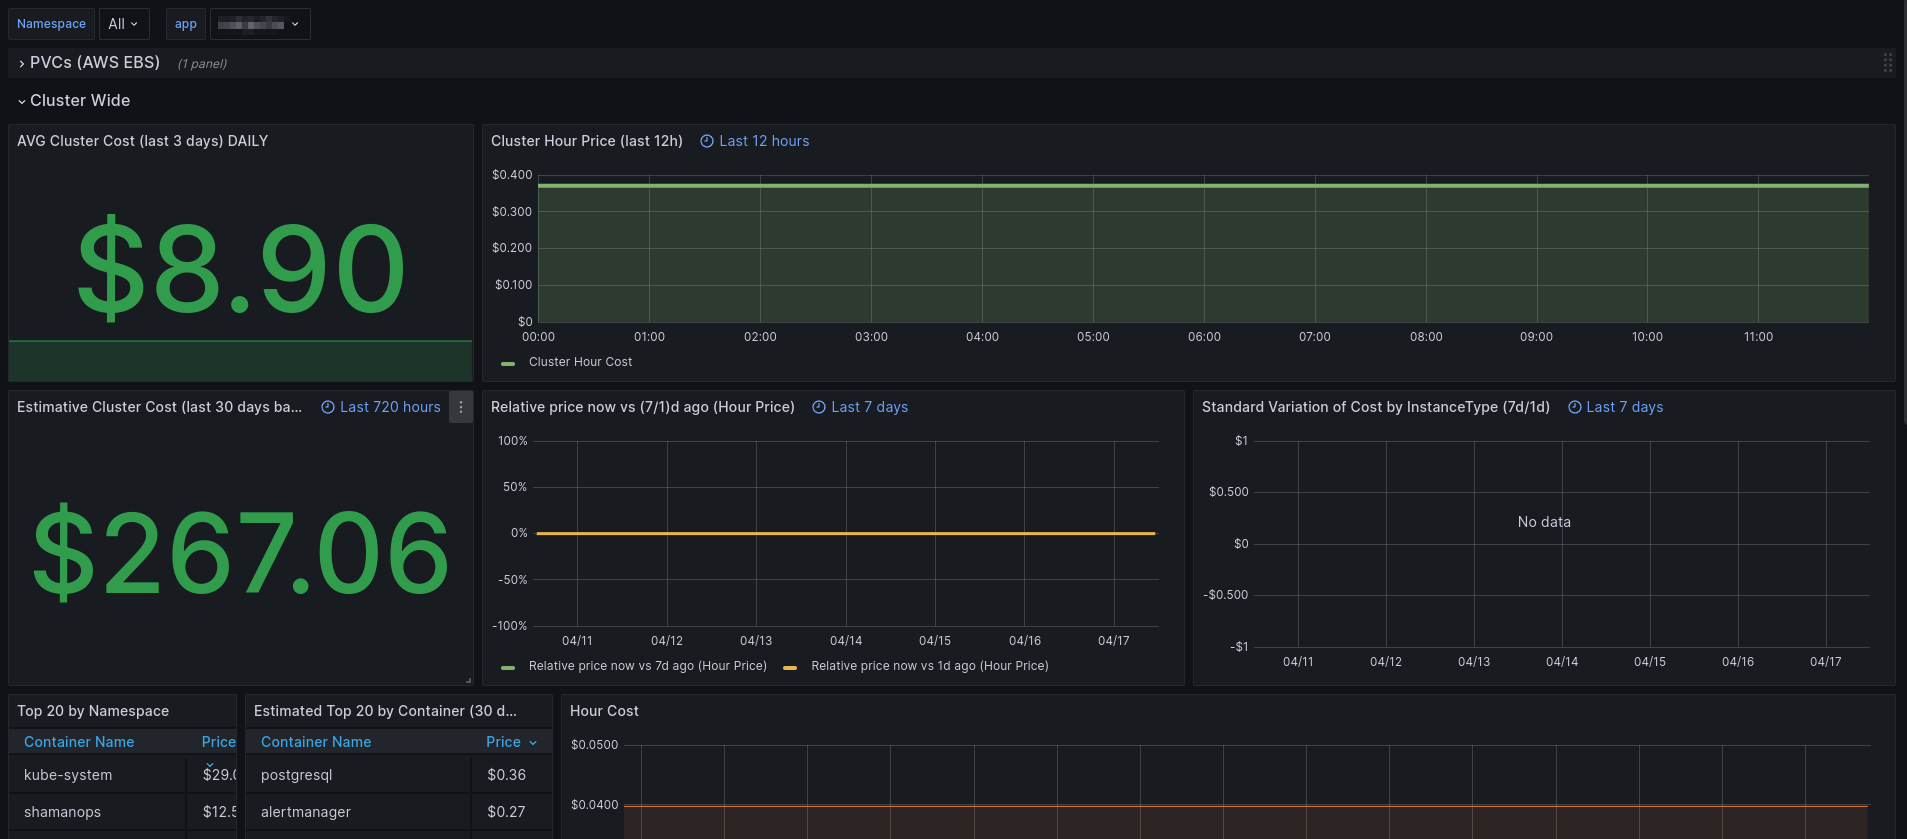
Cost allocations
In this dashboard you will be able to visualize the the real costs generated by your deployments hosted on your kubernetes-based platform.
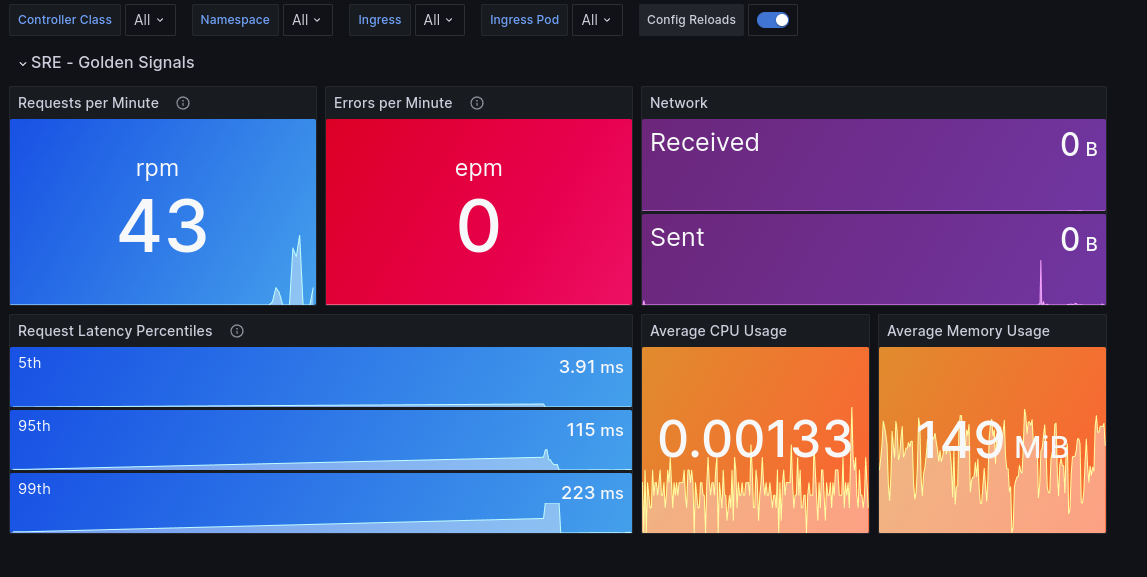
Golden Signals
In this dashboard you will be able to visualize the SRE Golden Signals defined by Google: Latency(Request Service Time), Traffic(User Demand), Errors(Rate of failed requests), Saturation (Overall capacity of the System).
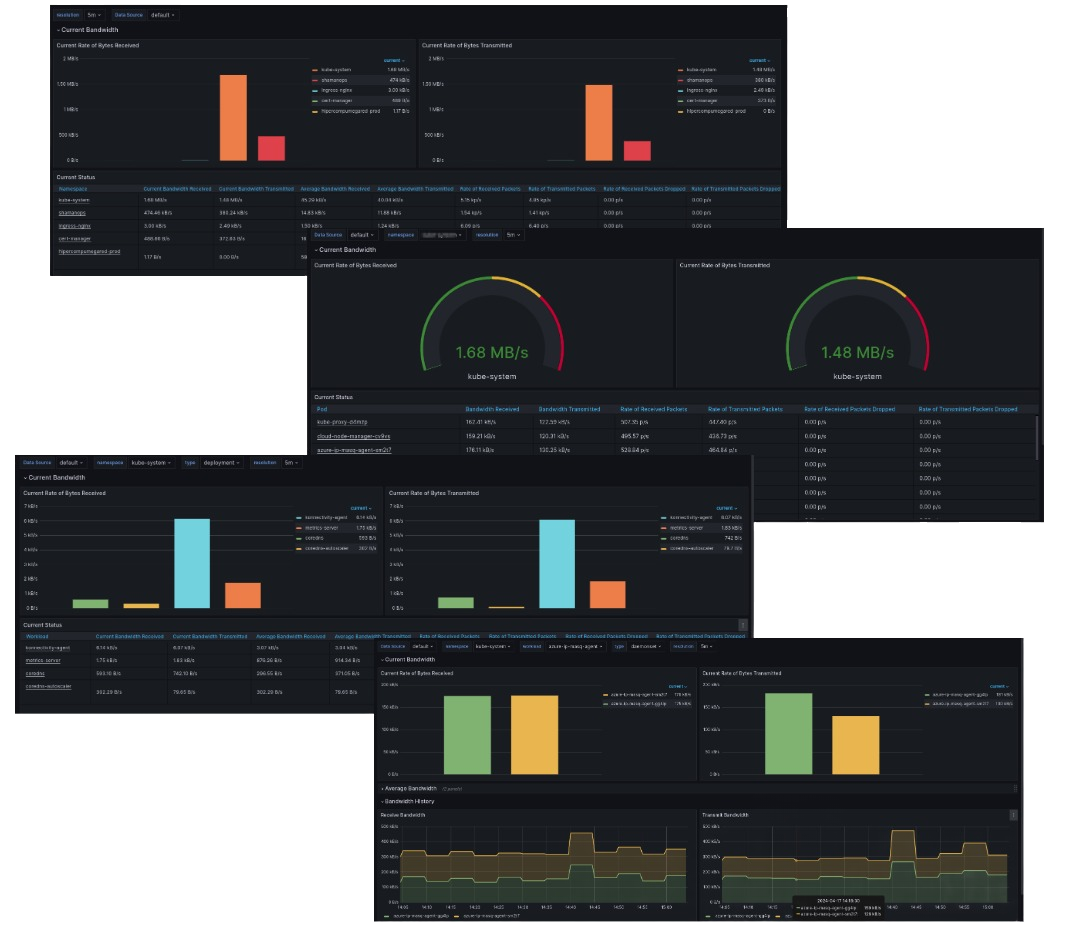
Networking
In this dashboard you will be able to visualize the status of the networking rates that are being used by the different components of the kubernetes-based platform such as: pods, nodes, namespaces, workloads.
And some more dashboards that will be useful in your ShamanOps adventure! ✨